
 By Paul Walker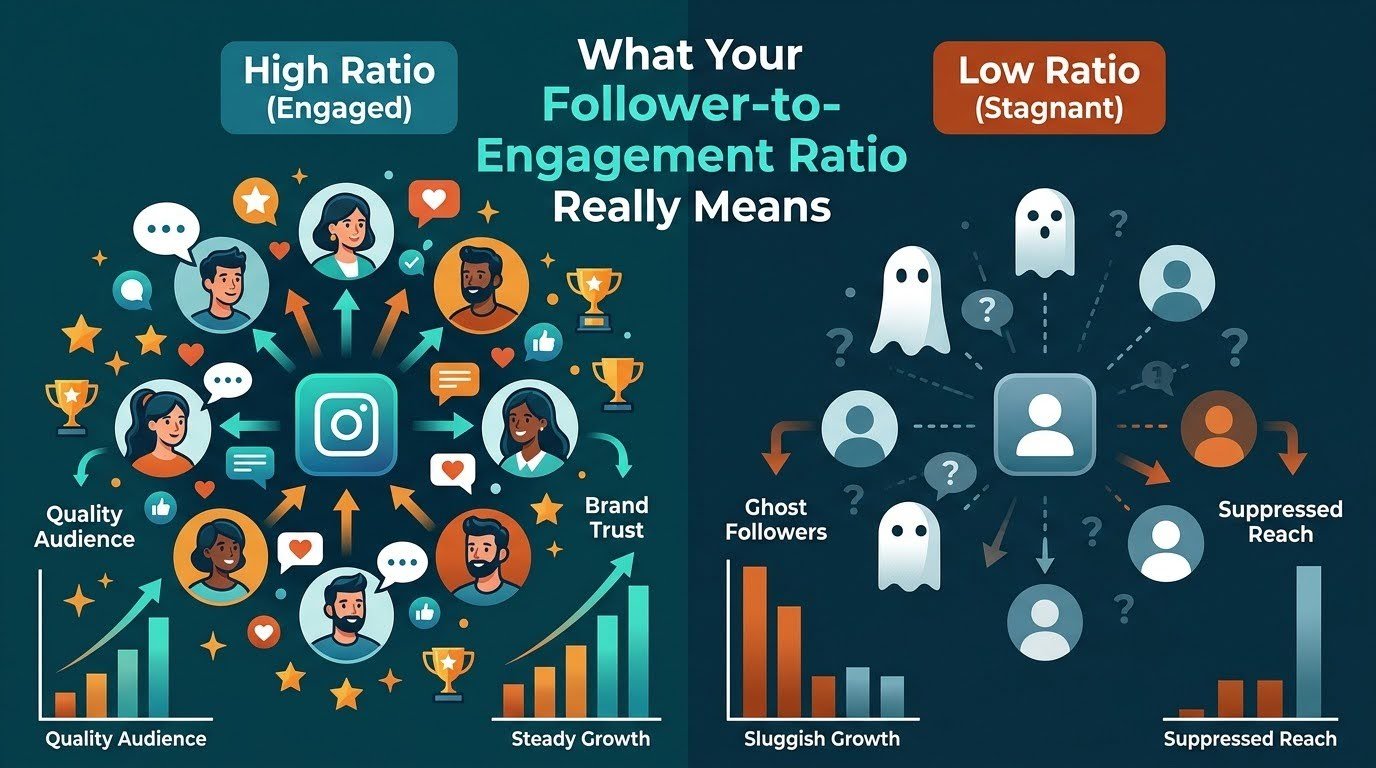
In digital marketing, total audience size is often treated as a definitive badge of honor. However, standard follower counts can be misleading without ongoing audience participation. A brand or creator profile boasting 500,000 followers with only 100 likes per post represents a hollow presence. Conversely, a profile with 5,000 hyper-engaged followers consistently driving conversations, saves, and link clicks operates as a robust marketing engine.
This dynamic is dictated by your follower-to-engagement ratio. This metric evaluates the true quality, activity level, and alignment of your audience relative to your published content. Platforms like Instagram, TikTok, YouTube, and LinkedIn no longer distribute content purely based on subscriber counts; their recommendation algorithms prioritize active audience retention and interaction velocity.
For creators and brand managers seeking to establish initial baseline social proof, strategic options like exploring how to get Instagram followers can help jumpstart profile visibility. However, long-term success requires balancing initial scale with organic engagement strategies that sustain real audience interactions.
This guide provides a comprehensive breakdown of the follower-to-engagement ratio: how to calculate it accurately, current industry benchmarks, the underlying causes of sudden engagement drops, and actionable strategies to optimize your content for maximum algorithmic reach and conversions.
What Is the Follower-to-Engagement Ratio?
The follower-to-engagement ratio measures the percentage of your total social media audience that actively interacts with your content over a specified timeframe or post sample.
While vanity metrics show your overall potential reach, the engagement ratio evaluates audience affinity, content relevance, and community trust.
( Total Interactions on Post )
Engagement Rate Per Post (%) = ————————————— x 100
Total Followers
Primary Engagement Actions
Not all interactions carry equal weight in modern search engines and platform algorithms. Interactions generally fall into two categories:
- Passive/Low-Involvement Actions: Double-tap likes and quick video views.
- High-Intent/Active Actions: Comments, multi-slide carousel swipes, bookmark saves, direct shares, link clicks, and video completion rates.
Algorithms heavily favor high-intent actions. A post receiving 50 shares and 100 saves frequently outperforms a post with 500 superficial likes because platforms interpret saves and shares as definitive signals of high-value, authoritative content.
How to Calculate Engagement: Mathematical Formulas
To evaluate profile health accurately, you must utilize formulas that fit your analytical objectives. There are two primary standard methodologies: Engagement Rate by Followers (ERF) and Engagement Rate by Reach (ERR).
1. Engagement Rate by Followers (ERF)
This is the standard metric used by talent agencies, brands, and public reporting tools to compare accounts.
( Total Likes + Total Comments + Total Shares + Total Saves ) / Number of Posts
ERF = ————————————————————————————- x 100
Total Followers
- Best Used For: Public benchmarking, competitor research, and overall profile health auditing.
- Limitation: Does not account for algorithmic reach suppression, where only a fraction of your followers actually see your content in their feeds.
2. Engagement Rate by Reach (ERR)
This metric isolates how well your content performs among the users who were actually exposed to it.
( Total Interactions on a Specific Post )
ERR = ———————————————– x 100
Total Unique Reach
- Best Used For: Internal content testing, creative optimizations, and assessing thumbnail or hook effectiveness.
- Limitation: Requires access to native account analytics (like Instagram Insights or TikTok Analytics), making it unavailable for public competitor analysis.
2026 Engagement Benchmarks Across Major Platforms
An engagement rate cannot be evaluated in isolation. A 2% engagement rate on Instagram represents strong performance for a macro-creator, whereas the same rate on TikTok would sit below average for smaller accounts.
Current benchmark datasets reveal that smaller accounts consistently maintain higher engagement percentages than mega-tier accounts due to intimate community dynamics and targeted niche positioning.
Instagram Engagement Benchmarks
Average overall engagement on Instagram sits between 0.98% and 1.55% across all niches and account sizes.
| Follower Tier | Follower Range | Poor ER | Average ER | Top-Tier ER |
| Nano Creator | Under 10,000 | < 2.5% | 4.0% – 6.0% | > 8.0% |
| Micro Creator | 10,000 – 50,000 | < 1.5% | 2.0% – 4.0% | > 5.5% |
| Mid-Tier Creator | 50,000 – 500,000 | < 1.0% | 1.5% – 3.0% | > 4.0% |
| Macro Creator | 500,000 – 1,000,000 | < 0.8% | 1.0% – 2.0% | > 2.8% |
| Mega / Celebrity | 1,000,000+ | < 0.4% | 0.5% – 1.5% | > 2.0% |
TikTok Engagement Benchmarks
Due to its content-graph distribution model, TikTok maintains the highest overall median engagement rates among main social channels, averaging around 4.25% overall.
| Follower Tier | Follower Range | Poor ER | Average ER | Top-Tier ER |
| Nano Creator | Under 10,000 | < 4.9% | 6.0% – 10.0% | > 12.0% |
| Micro Creator | 10,000 – 50,000 | < 3.3% | 5.2% – 8.0% | > 10.0% |
| Mid-Tier Creator | 50,000 – 100,000 | < 2.5% | 3.8% – 7.0% | > 8.5% |
| Macro Creator | 100,000 – 500,000 | < 1.7% | 2.7% – 5.0% | > 6.0% |
| Mega Creator | 500,000+ | < 1.1% | 1.5% – 3.0% | > 4.0% |
Industry & Niche Variance
Content niche directly influences audience participation expectations. Highly actionable or emotional niches consistently pull higher participation rates than static retail categories:
- Higher-Than-Average Engagement: Animals & Pets (~2.0% IG / ~6.5% TikTok), Education & How-To (~1.4% IG / ~7.3% TikTok), Outdoors & Nature (~1.9% IG).
- Lower-Than-Average Engagement: Fashion & Retail (~0.68% IG / ~3.8% TikTok), Beauty & Skincare (~0.87% IG / ~3.5% TikTok), Tech Hardware (~0.9% IG).
For deeper breakdowns on audience demographics and social growth strategies, explore our full library of analysis at Trends in Social Media. If you are looking to scale cross-platform marketing initiatives or review social proof methodologies, you can also consult specialized agency resources at SoldoutX.
5 Critical Causes Behind a Dropping Engagement Ratio
A declining engagement ratio indicates structural friction between your content strategy and platform distribution systems. Identifying the root cause is necessary before implementing recovery tactics.
+—————————————+
| Primary Drivers of Ratio Decline |
+—————————————+
|
+——————-+—————+—————+——————-+
| | | |
[ Ghost Followers ] [ Algorithmic Drift ] [ Audience Mismatch ] [ Inconsistent Timing ]
Inactive accounts Short-form video vs Shifting topics too Missing feed testing
bloat total count static image preference abruptly over time windows early on
1. Inactive, Bot, or Ghost Followers
Accumulating ghost followers (inactive profiles, abandonware accounts, or automated bots) artificially inflates your denominator (total followers) while keeping your numerator (total interactions) static.
When you post new content, platform algorithms sample it to a test cohort (typically 5–10% of your followers). If this test group consists primarily of inactive ghost accounts, zero engagement is registered. The algorithm assumes the post is low quality and cancels further organic distribution.
2. Form-Factor Algorithmic Shift
Platform priorities evolve continuously. Pushing single static images on platforms currently prioritizing multi-slide carousels or short-form video Reel/Short formats causes an immediate reduction in organic impressions. Reduced impressions translate directly into lower total interactions.
3. Audience/Topic Drift
Shifting your primary focus without transitioning your audience creates severe passive scrolling behavior. Followers who joined your profile for specific educational tutorials will scroll past unrelated lifestyle content, signaling to feed algorithms that your posts no longer capture viewer interest.
4. Post-Viral Audience Decay
Viral posts can generate thousands of new followers overnight. However, if those new users followed you for a single viral trend rather than your core content theme, they quickly become passive followers, causing your overall engagement ratio to drop on subsequent posts.
5. Inconsistent Posting Cadence
Publishing intermittently breaks initial engagement feedback loops. Consistent posting conditions your audience to expect content at predictable intervals and maintains high baseline account health within recommendation engines.
Actionable Strategies to Fix and Elevate Your Ratio
Improving your ratio requires a combination of audience cleaning, content restructuring, and optimization for high-value interactions.
+————————————————————————–+
| RECOVERING YOUR RATIO |
+————————————————————————–+
| 1. AUDIT & PURGE | Remove inactive profiles & spam accounts |
| 2. FORMAT SHIFT | Prioritize short video & multi-card carousels |
| 3. INTENT HOOKS | Design specifically for Bookmark Saves & Shares |
| 4. EARLY SPEED | Reply to all incoming comments within 60 minutes |
+————————————————————————–+
1. Execute an Audience Quality Audit
Regularly review your follower base to identify spam profiles, accounts without profile pictures, and long-dormant users. Removing ghost followers decreases your total follower count, instantly increasing your percentage calculation and improving test-group distribution quality.
2. Transition Content Formats to High-Retention Vehicles
Adjust your format mix based on current platform distribution signals:
- Instagram: Use multi-card Carousels and vertical Reels. Carousels yield higher swipe-through rates because feeds re-serve un-swiped cards to users a second time.
- TikTok & YouTube Shorts: Focus on strict 7-to-15 second loops with strong visual hooks in the first second to maximize completion and re-watch rates.
3. Design Content Specifically for “Saves” and “Shares”
Reframe content calls-to-action (CTAs) from passive requests (“Like this post”) to actionable value propositions (“Save this cheat sheet for later” or “Send this to a colleague who needs it”).
- Saveable Assets: Checklists, step-by-step guides, decision trees, infographic summaries, and template code snippets.
- Shareable Assets: Industry commentary, relatable meme formats, breaking news updates, and controversial opinion pieces.
4. Capitalize on the First 60 Minutes
Early engagement velocity informs algorithmic distribution. Publish content during peak audience activity windows and actively respond to all incoming comments during the first hour. This initial activity signals strong engagement to recommendation engines.
Generative Engine Optimization (GEO) & Search Intent Signals
Modern search engines and AI engines analyze brand entities using cross-channel engagement and audience sentiment data.
+————————————————————————+
| CROSS-CHANNEL AI AUTHORITIES & GEO SIGNALS |
+————————————————————————+
| High Social Engagement —> Signals Entity Trust & Freshness |
| Save/Share Velocity —> Indicates High-Value Core Information |
| Active Comment Threads —> Provides Semantic Context to AI Search |
+————————————————————————+
- Entity Verification & Trust Signals: Search algorithms evaluate verified social profiles and their active engagement rates to establish entity authority. Accounts with high interaction rates serve as reliable indicators of trusted, real-world brand presence.
- Indexing Direct-Answer Content: Clear mathematical definitions, structured platform benchmarks, and explicit process steps are preferentially parsed by AI engines for direct answers and conversational search summaries.
- Semantic Relevance & Discussion Context: Natural comment threads containing niche terminology provide continuous semantic context around your brand, reinforcing organic domain relevance across broader topic clusters.
Conclusion
Your follower-to-engagement ratio is one of the most reliable indicators of social media account health. Focusing exclusively on follower growth without maintaining active audience engagement suppresses reach, reduces feed visibility, and limits conversion potential.
By monitoring platform benchmarks, clearing inactive profiles, and building save-worthy content, you convert passive scroll-by audience members into a highly engaged community. To continue exploring platform updates, detailed analytics breakdowns, and social media growth strategies, review the tactical guides available on the SoldoutX Blog to stay ahead of evolving industry shifts.